EDIT: I provided a quick update here, and it will be the main entrance of a post series regarding this subject, cheers ! https://roelandtn.frama.io/post/update-for-the-mexico-project/
Hello there ! It has been a long time since my last post. That’s because of a great project I’m working on for my Master degree. Explanations can be messy, we are at an early stage, just collecting data and try to select the most useful ones. Hold on a bit and don’t hesitate to contact me to clarify things.
So, this project is about the social division of the residential space of the Greater Mexico City. That’s the title, and a long one.
TL; DR
We take a lot of census data from INEGI and we try to caracterize the social space around Mexico City. The main goal is to learn to use principal component analysis and correspondence analysis on big loads of data.
We have a tutor from the University who is a geographer and gives us directions. He is pretty open so we can use any tool we want, even if he is more skillfull with SAS than R for data analysis (and knows nothing about Python).
The study
The Master Degree I’m taking on this year is as a large part of data analysis (I’m so happy with it), so we learn several languages and softwares to do the analysis. So we have lessons about R (at least R-base), SAS and SPAD. The first one is FOSS and well know in the data analysis area, the others are proprietary software and seems to have a lots of users too in the industry.
This project aims to get a grab of those analysis tools by praticing it on real data and studying it with a geographic point of view (this master degree major is Geography). The 18 students are spearted in 3 peoples teams, 2 teams studying the United States of Mexico, 2 others the obesity in France (especially Paris area) and the last 2 teams make analysis of rural France.
Studying the residential space of the Greater Mexico
Choose the subject and find data
That’s probably the trickiest part of the analysis, definying the residential space and its componants. Our tutor proposes us to use census data from the INEGI, the mexican national institut of statistics and geography, and especially the data from the 2010 census and the 2015 intercensal survey and as a geographical mesh, the mexican administrative division from the federate states (entidades federativas) to the city block (Manzana). Those 2 survey provides data about the populations (Población) and housing (Vivienda) but not in the same way. Since ate the beginnig, we did’nt choose a specific subject (there was 6 of them), we ended up downloading all the data and making big databases in preparation of the analysis we will make.
2010 data
2010 data are provided in xls or dbf files, aggregated to the manzana, one file by state and containging both data about the population and the housing. There is 186 variables in each files. The xls files takes around 4.1 Gb of disk space for the whole Mexico country.
2015 data
The 2015 in the other hand, can be downloaded into SAS, CSV, DTA or SAV files. SAS files takes around 20 Gb of disk space, 7 Gb for csv files. The data are not aggregated, one row stands for 1 person or one housing. It was a not a full census, so only 1 mexican on 5 have been interviewed, but it still represents 22 billions people. The anonymity is provided by the fact that smallest area unit is the urban locality (Localidad) which contains around 50 000 persons. The people and the housing are separated in 2 files, so it representes 64 files to work with. Make a big databases from all those files wasn’t easy, but it is another story.
Conclusion
I’ll make 2 separated post about how I handled and cleaned the data, one for each survey, with the code I used. We are just at this step, raw clean data for the area we are working on and an idea of the variables we ar going to use. Next step is to perform analysis, clean the things we didn’t get the first time, find most the important variables and then cartography and analysis the results. There is still work to do, I’ll post about that when we’ll be working on it.
See you soon here.
.jpg)
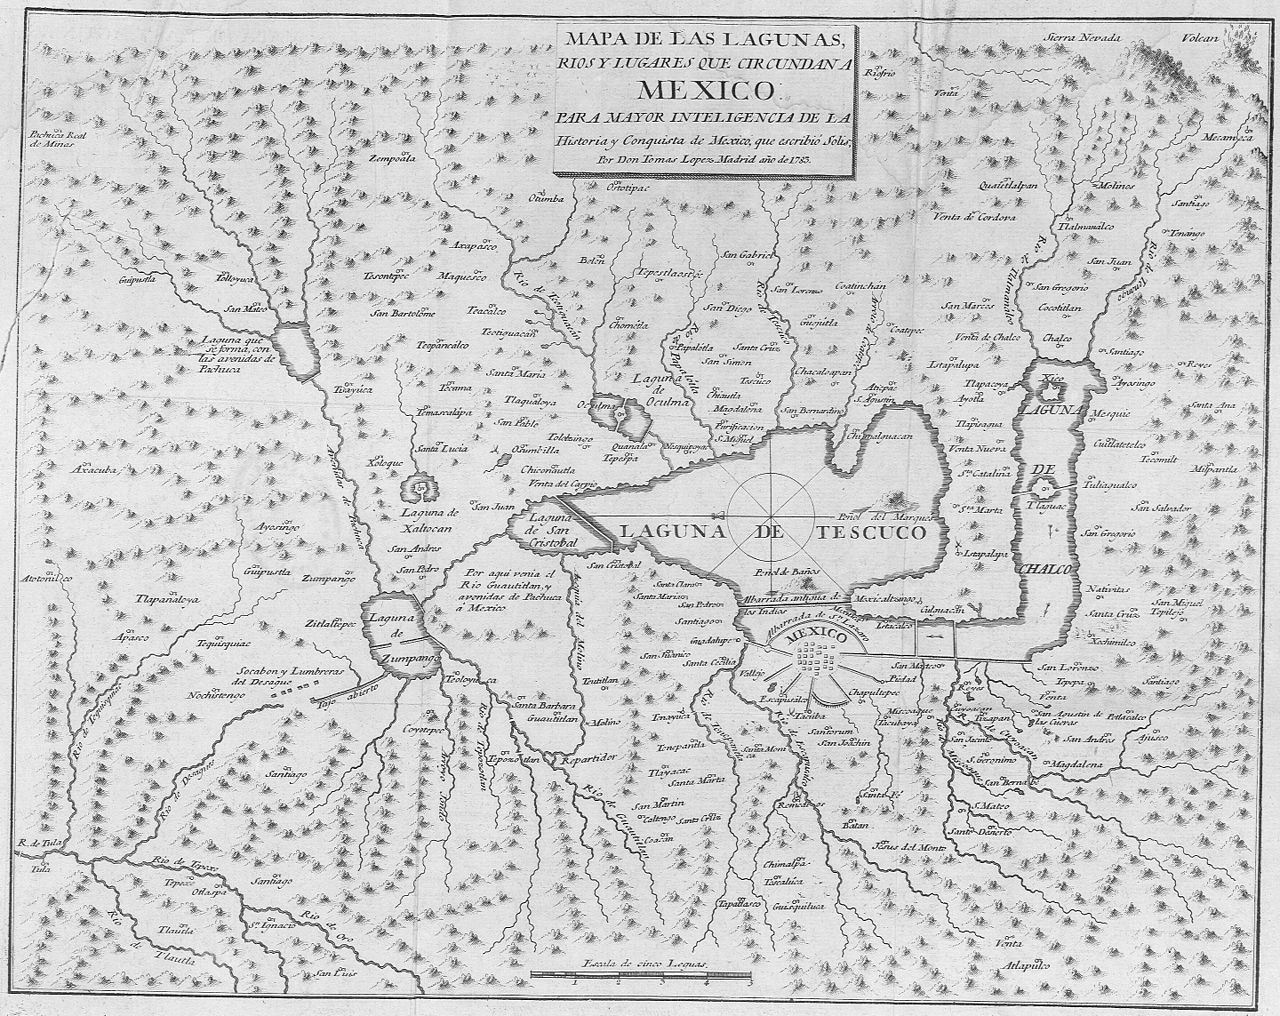
Property of Fondo Antiguo de la Biblioteca de la Universidad de Sevilla, licence cc-by-2.0.
Share this post
Twitter
Google+
Reddit
LinkedIn
Email