This is the first part of a series of blog post regarding a project I did with 2 master degree colleagues.
The main entry to this series is here.
Today, we will discuss the problematic, the data and the variables selection from those data in respect of the problematic. Althought it is not really technical post, it provides some context and elements do someone who wants to redo the analysis.
Problematic
The subject we choose was “Etude de la division sociale de l’espace résidentiel de la Zone métropolitaine de Mexico” which we can translate by: “Social division study in the residential space of the Greater Mexico Area”. The real goal was to practice what we learned about data analysis on a real large dataset.
So if the data source was provided by the teacher, and was census data, one of our first concern was : “How to represent the social division in this area with socio-demographic data ?”
Data source
The main data source was the Mexican census, the Instituto National de Estadistica y Geografia (INEGI).
We originally planned to work with data from the intercensus survey of 2015 and the complete enquiry of 2010 in order to make a comparison between those 2 dates. We started with 2015 and it was already a lot of data to analyze so we didn’t had the time to pursue onto 2010, it was time to write the report and create the website and publish the post. Note that website was a not mandatory requirement but we decided to do it anyway, partially do show the possibilities of blogdown.
2015
The raw data are available here : http://en.www.inegi.org.mx/proyectos/enchogares/especiales/intercensal/
It is a partial survey, interviewing around 1 Mexican out of 5 in cities larger than 50 000 inhabitants. Each state (there 32 states in Mexico), have two cvs files: one the inhabitants (the PERSONA files) and one for the housing (the VIVIENDA files). Each line in those files representes a person or an housing. There is more 22 millions people in the whole data set. Each people or housing has a specific ID and every people is linked to his housing with its vivienda ID.
Before choosing the subject, we worked on assembling the data and it represented 7 GB of data, 22 millions lines and more than 180 columns. We did it wih Python and Pandas because we were not able to handle that amount of data with R. We tried several packages to mitigate this issue, they were not effective enough or we weren’t able to make them work properly, so we decided to move on with python to shape and extract the data.
At the same time, we choose the subject and this subject is limited to Greater Mexico area, so the we didn’t need all the 22 millions lines and we worked only with the 3 states included in the Greater Mexico. We then subset the municipalities to the 76 ones who form the Greater Mexico, so it was a lighter dataset to handle at the end.
Please notice that each row represents an individual or a housing but anonimity is provided the minimal scale use. The minimal scale provided is the munipality and it represents 50 000 people, but we loses the fineness for the geographical study.
Since, only 1 Mexican out of 5 has been interviewed, the data contains a column called factor which is a multpiplcative factor. For example, this row represents 3 or 4 people in the entire population, this housing represents 2 housings, etc.
2010
As originally we planned to work on 2010, we extracted the data regarding the study area bu we didn’t exploit them at the end. For this enquiry, all the people and housing have been interviewed, but the data are already aggregated by Manzana, a small statistical unit. Plus some variables have been aggregated too. It is provided in a set of 32 xls files (one by state) containing data about peoples and housings and it represents 4 GB of data.
Those data are available here: http://en.www.inegi.org.mx/proyectos/ccpv/2010/
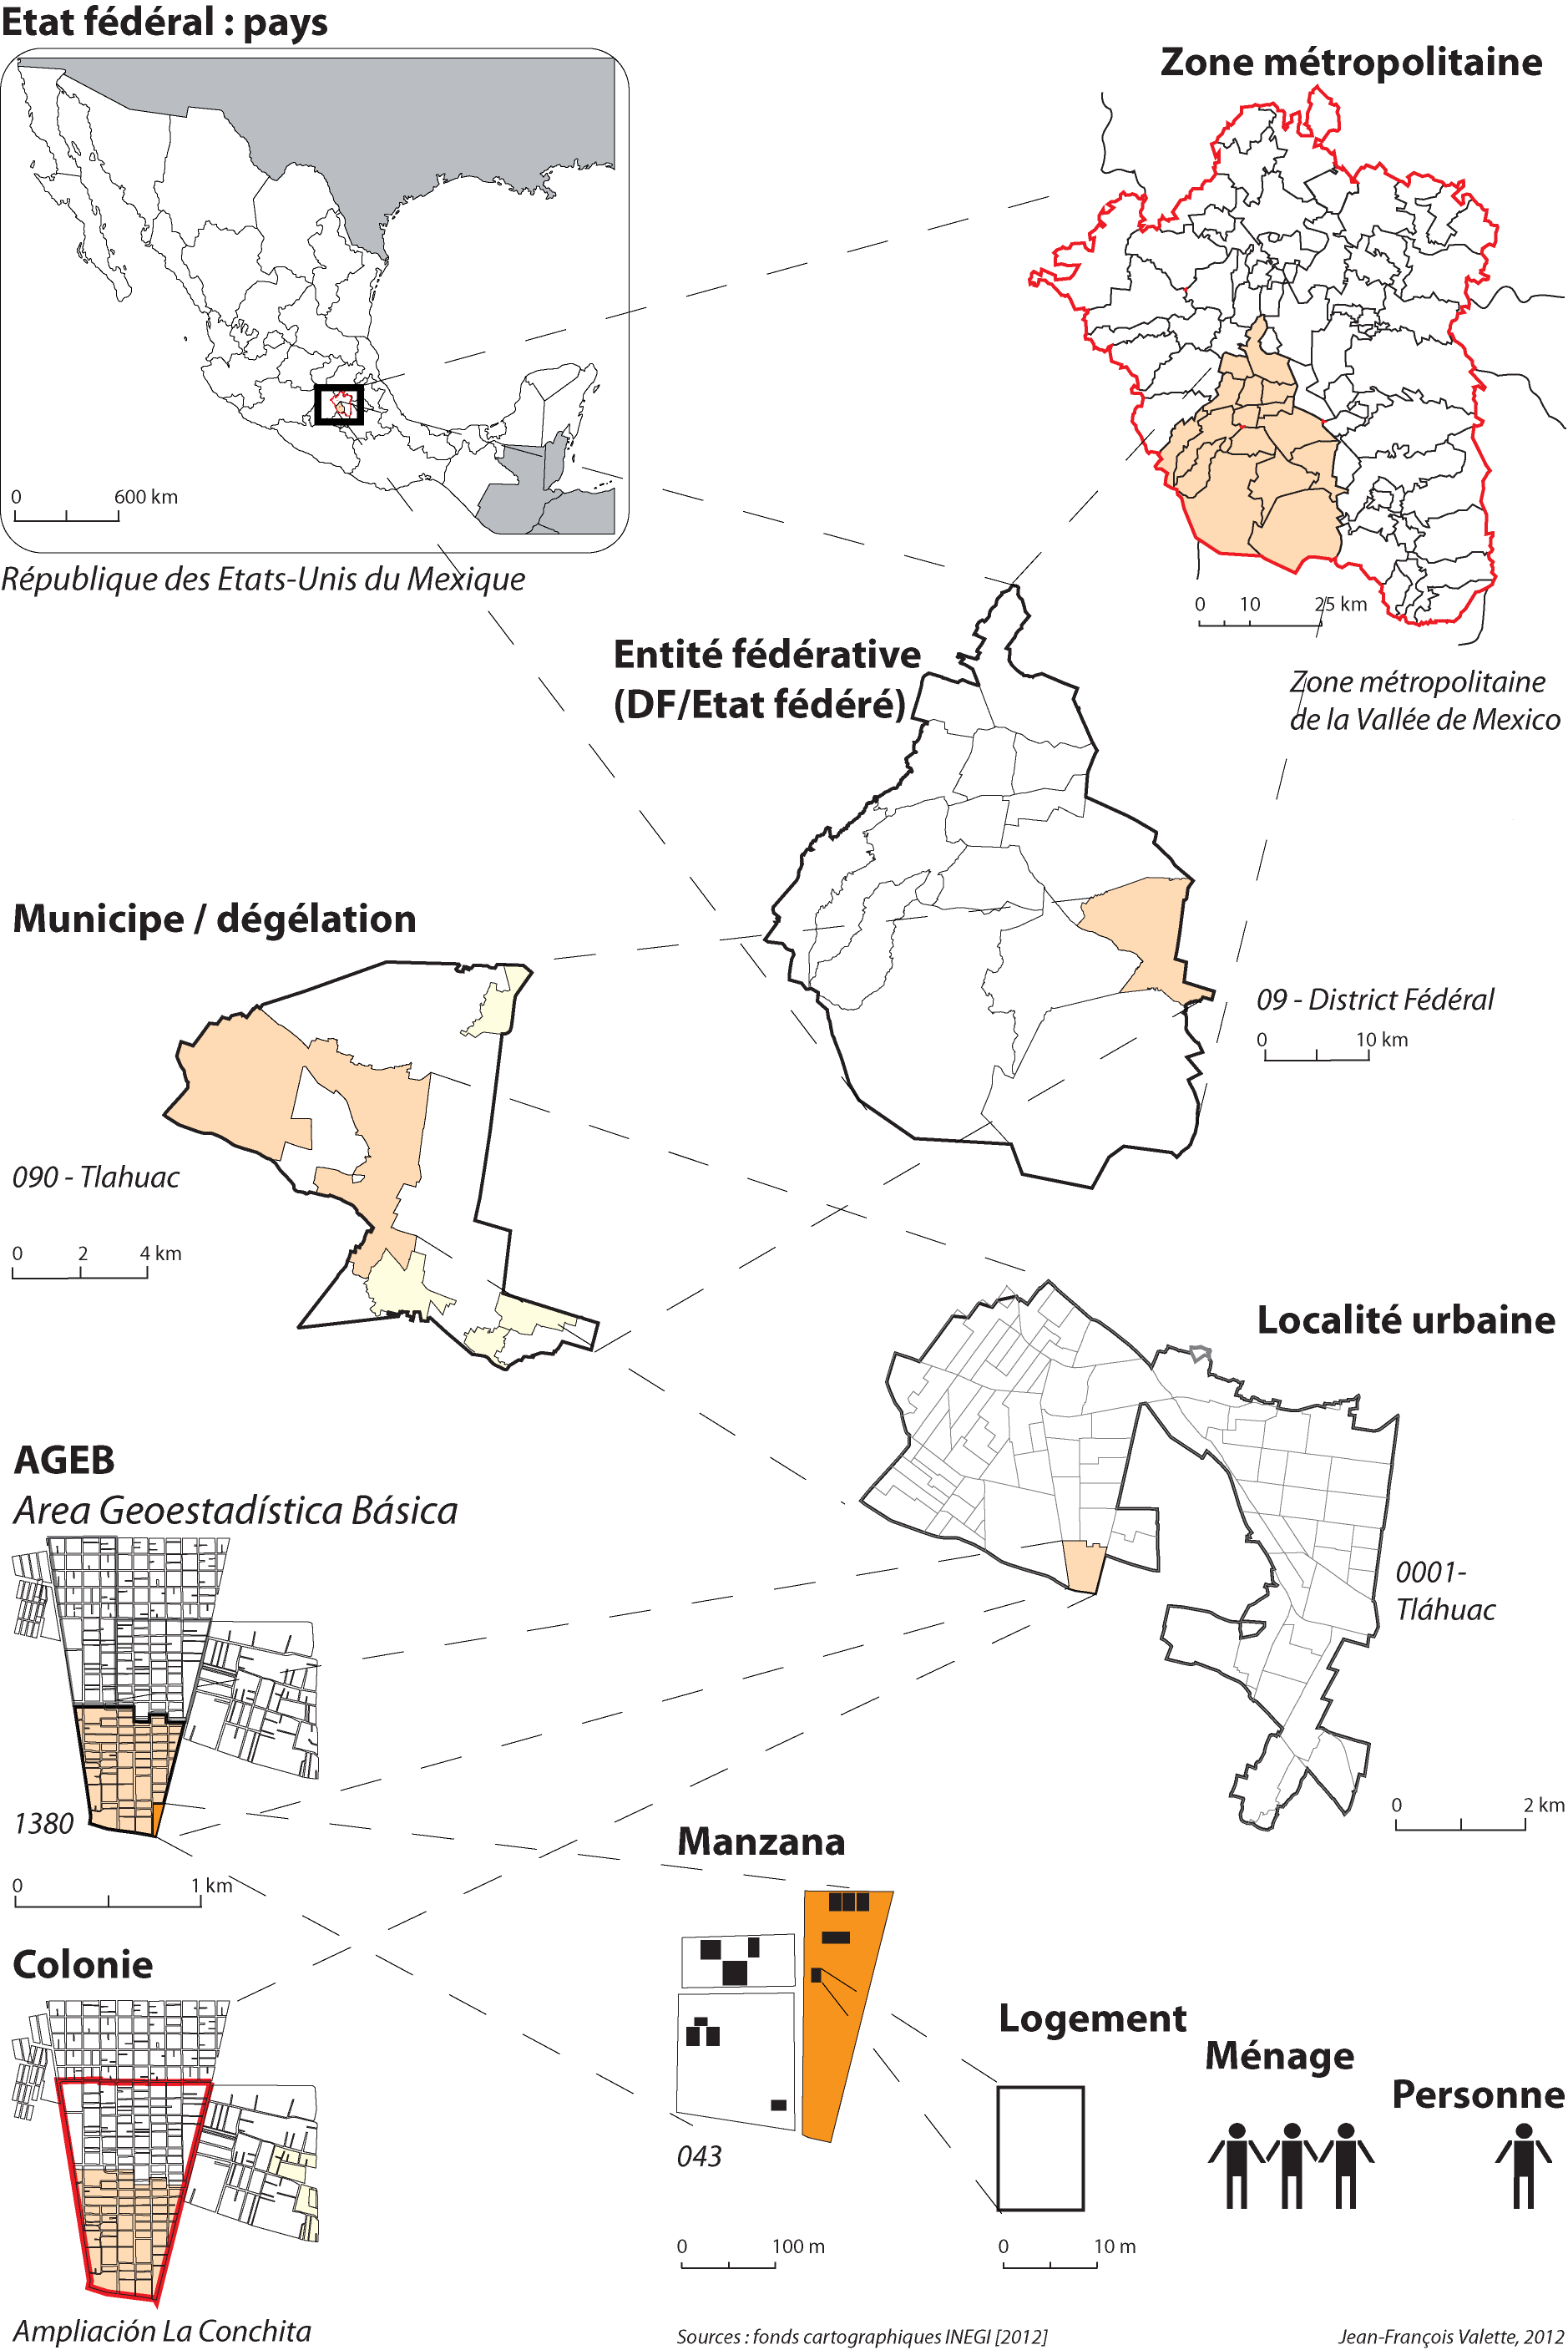
Geographical and administrative meshing
This picture is provided with the courtesy of Jean-François Valette, professor at Paris 8 University and who was responsible for this project.
Variable selection
As we didn’t need all the variables and were not able to treat all of them, we limited our dataset to 46 variables that we thought will help us to characterize the social division of ou study area.
I won’t list all of them, each of them is already explained (in French) on the project website.
It is mostly about the housing, its type, the type offloor, how many people lived in there, in how many rooms. We studied all the equipement of the housing (water and electricity access, toilets, phone and internet, television, etc), because we think that poorest housing will be less equipped.
We also studied some people aspects as employement status, education level, if the person is indigenous or speak a local dialect, etc).
Please be aware that is not a research paper or a business analysis, this is a school project done by students in work/study training program, on their spare time, week-end and holidays in less than 3 months. So there can be flaws and bias in this study.
Next part of this series will be talking about the data management and its handling.
Stay tuned !
Share this post
Twitter
Google+
Reddit
LinkedIn
Email